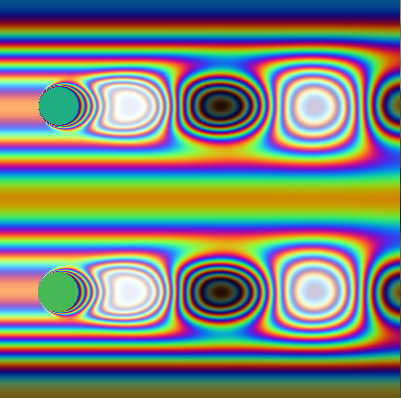
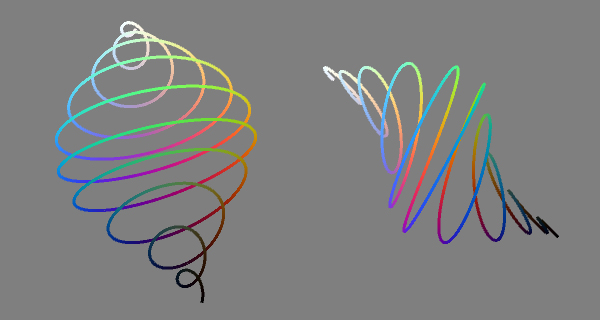
I was tinkering with some GLSL shaders in Processing, and I needed a way to visualize a value that smoothly changes from 0 to 1, showing a lot more than the 256 levels of gray that you’d normally see. So I wrote a little pseudocolor function that spirals through colorspace from black to white, hitting various hues along the way. It’s fun, and pretty, and very rungy-chungy, so I thought I’d post it here.
vec4 pseudo3(float val) {float reps = 20.0;
float pi = 3.14159256;
float bright = val;
float con = 0.25 – 0.20 * cos(val * pi * 2.0);
float sat = 0.66 – 0.25 * cos(val * pi * 2.0);
return vec4(sin(val*pi*reps)*con+bright,
sin(val*pi*reps – pi*0.663 * sat)*con+bright,
sin(val*pi*reps – pi*1.333 * sat)*con+bright,
1.0);
}


Fun!
Fun! I was considering something somewhat like this when I was displaying height field data and the details were mostly getting lost. I’ll keep this in mind!
So it turns out, of course, that something like this has already been implemented in the scientific community: Dave Green’s CUBEHELIX paper was published in 2011. Apparently it’s also available in MatLab, and as a d3 plugin.