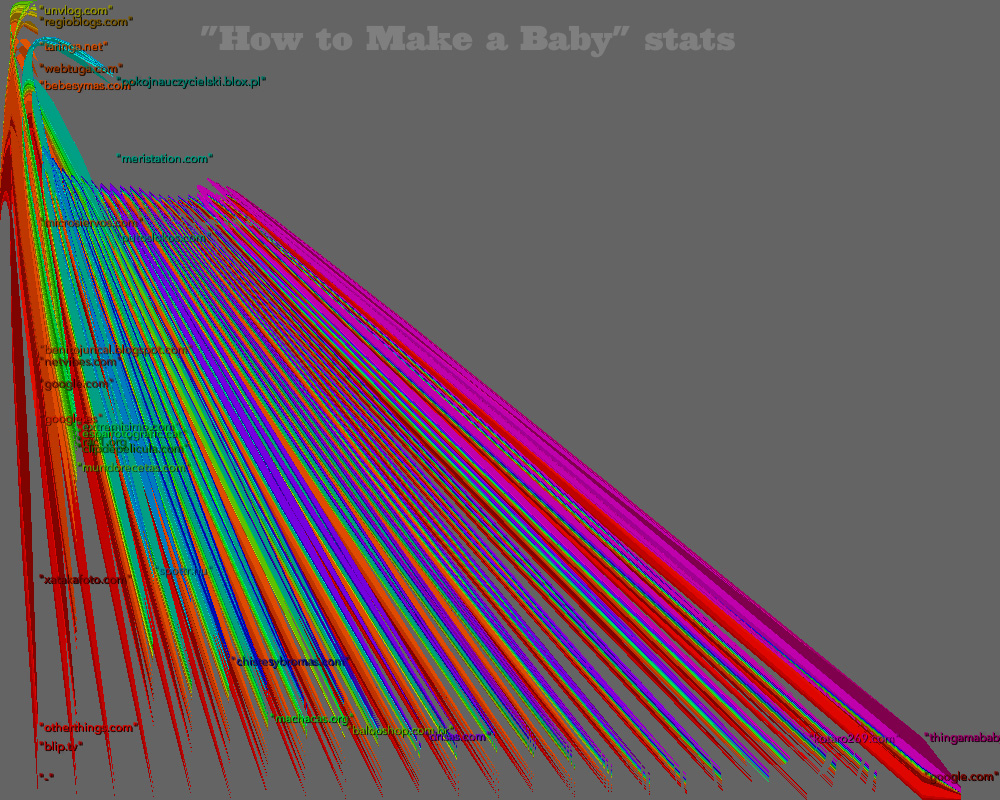
I’m fascinated by the way our viral video has been spreading around the web. It’s a very chaotic process. One day it’ll get a few hundred views, and the next day 60,000. Blip.tv gives some very basic statistics, but it doesn’t really tell the story of how the clip’s popularity spreads from one community to another. So I’ve started using Processing to try to visualize it. Processing is really easy to learn to use, but certain commands, like bezierVertex(), have slightly less-than-intuitive arguments. The image above was the result of one of several failed attempts to understand that particular function.

